Posts

Showing posts with the label Performance Tuning

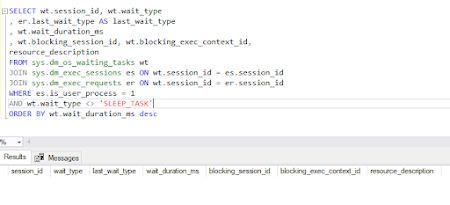
IO Usage at the Database Level and file level

IO Usage at the Database Level We can build out further on this information and present the data in a more usable format and provide exactly what we need vs. what the developer of the DMV/DMF may have foreseen it used for by writing our own query with it incorporated into it. WITH IO_Per_DB AS (SELECT DB_NAME(database_id) AS Db , CONVERT(DECIMAL(12,2), SUM(num_of_bytes_read + num_of_bytes_written) / 1024 / 1024) AS TotalMb FROM sys.dm_io_virtual_file_stats(NULL, NULL) dmivfs GROUP BY database_id) SELECT Db ,TotalMb ,CAST(TotalMb / SUM(TotalMb) OVER() * 100 AS DECIMAL(5,2)) AS [I/O] FROM IO_Per_DB ORDER BY [I/O] DESC; The above query now displays total MBPs and percentage of IO across entire SQL Server per database. If we need to few this in a more detailed perspective , i.e. from the data file view vs. the database, ensuring we identify prospective high IO areas that could become a bottleneck, we could use the following query: WITH IO_Per_DB_Per_File AS (SELECT DB_NAME(dmivfs.database_

The Importance of Real-Time Latch Monitoring in SQL Server

Image
  Crucial for Performance and Responsiveness: Monitoring latches in real-time is essential for maintaining optimal performance and responsiveness in a SQL Server database system. Role of Latches: Latches, being lightweight synchronization primitives, play a pivotal role in safeguarding in-memory structures from concurrent access. Impact of Excessive Latch Contention: Excessive latch contention can lead to queuing and delays, significantly impacting the throughput and responsiveness of the system. Swift Detection of Bottlenecks: Vigilant observation of latch behaviors in real-time allows database administrators to swiftly detect potential bottlenecks. Preventing Severe Performance Issues: Addressing issues before they escalate into severe performance degradation is crucial for maintaining system health. Insights into Dynamic Workloads: Real-time monitoring not only identifies issues promptly but also provides valuable insights into dynamic workloads and interactions within the server. P

Indirect Checkpoint

In the realm of SQL Server, database management is a complex art. One crucial aspect of this management is controlling when data is written from memory to disk through a process called checkpointing. While SQL Server offers automatic checkpoints, a more precise tool in your arsenal is the indirect checkpoint. Indirect Checkpoint in SQL Server Purpose: The primary aim of indirect checkpoints is to alleviate the I/O spikes often associated with traditional automatic checkpoints. By opting for indirect checkpoints, you gain better control and predictability over the checkpoint process. Database Configuration: Enabling indirect checkpoints for a specific database involves setting the TARGET_RECOVERY_TIME option at the database level. This setting defines the desired time interval (in seconds) between checkpoint events for that specific database. Predictable Checkpoints: Indirect checkpoints empower you to specify the frequency of checkpoints for each database. This level of granularity hel

Troubleshooting Guide: Unable to Connect to SQL Server Remotely

  Troubleshooting Guide: Unable to Connect to SQL Server Remotely   Introduction: Connecting to a SQL Server from a remote machine is a common requirement for database administrators and developers. However, it can be frustrating when connectivity issues arise. In this troubleshooting guide, I'll walk you through the essential steps to diagnose and resolve the problem when you cannot connect to a SQL Server from a remote machine.   Step 1: Ensure SQL Server is Running Open SQL Server Configuration Manager to verify that the SQL Server service is up and running on the target machine. Step 2: Enable TCP/IP In SQL Server Configuration Manager, navigate to "SQL Server Network Configuration" and select "Protocols for [Your SQL Server Instance]." Ensure that TCP/IP is enabled. If not, right-click on TCP/IP and select "Enable." Step 3: Allow Remote Connections Open SQL Server Management Studio (SSMS) and connect to the SQL Server instanc

Unlocking the Power of Data Compression in SQL Server

  Unlocking the Power of Data Compression in SQL Server   In the world of relational databases, storage optimization is often a top priority. SQL Server, a popular relational database management system, offers two compression techniques: page compression and row compression. But how do you choose between them, and what are the trade-offs? Let's dive in and demystify these techniques. Page Compression: Maximizing Storage Efficiency Advantages: High Storage Savings: Page compression, as the name suggests, works at the page level. It employs advanced algorithms to significantly reduce the storage space required for your data. If you're dealing with a data warehouse or large datasets, this is your go-to option. Disk I/O Improvement: By shrinking the data footprint on disk, page compression can reduce the amount of data read from and written to storage. This can lead to better I/O performance, particularly for read-heavy workloads.   Disadvantages: CPU Overhead:

CPU and Memory in SQL server

  Every database administrator faces CPU and memory issues frequently.  If you are really interested in knowing how the CPU processes and how memory is dependent on it, then you should go through this blog In SQL Server, the CPU and memory are two critical resources that work in tandem to ensure optimal performance of the database system. CPU is responsible for executing instructions and processing queries, while memory is responsible for storing data and executing instructions quickly. The relation between CPU and memory is that the CPU requires data from memory to perform tasks efficiently. When a query is executed in SQL Server, it requires memory to store data, and the CPU processes the query to retrieve and manipulate the data. Therefore, if there is insufficient memory available, the CPU has to wait for data to be loaded from the disk, leading to performance issues. Conversely, if the CPU is too slow, it will take longer to process queries and may cause the memory to be blocked u

High CPU usage in SQL Server

  Reasons for high CPU usage in SQL Server. Some common causes  Inefficient queries: Queries that are poorly written or inefficient can consume a large amount of CPU resources. Lack of indexes: If there are no indexes on the tables, SQL Server has to perform full table scans, which can be CPU-intensive. Large data volumes: When working with large data volumes, SQL Server may need to use more CPU resources to process the data. High concurrency: If there are a large number of users or connections executing queries concurrently, this can lead to high CPU usage. Resource-intensive operations: Certain operations such as sorting, aggregating, or joining large data sets can consume significant CPU resources. Server misconfiguration: Incorrectly configured settings, such as maximum degree of parallelism (MAXDOP), can cause excessive CPU usage. Hardware limitations: If the server hardware is not sufficient to handle the workload, this can cause high CPU usage. To find the SPID (Server Proc

Query Store

Query Store  If you are working with SQL Server 2016 or higher, even Express, there is a new native tool that you should know about: Query Store. Query Store is a feature that can be enabled on any SQL Server 2016 instance or higher, even when compatibility mode is lower. In this blog post, we will explore the features of Query Store and how to configure it. Query Store Features: Query Store is a native tool that captures historical query information. Unlike previous native tools, data captured by Query Store will outlive performance changes, failovers, reboots, and even SQL upgrades because data is stored in tables inside each database. There is minimal I/O impact since the data collected is stored in memory then asynchronously persisted to disk. Query Store gathers two important parts of historical query information. First, we have plan details with stats detailing if a seek or scan was performed and the number of plans our queries have in cache. Then we have runtime stats like